Hopefully everyone has had a chance to play around with the new PUM Dashboard delivered in the 8.55 PIs. If not, Logesh from leanITdesigns has a very good write up on it. Dan and I also spend some time discussing it in Podcast #20 – PUM Dashboard. It is basically a new one stop shop for managing the PUM maintenance process. It uses a Fluid dashboard to help keep track of BUGs, customizations and test cases.
I have found the dashboard to be a very nice tool with a lot of promise. That said, I don’t think it is mature enough to really work for ALL your PUM maintenance planning needs. In the near future I can see both Oracle(tweaking the dashboard) and organizations(tweaking their maintenance planning processes) working together to make this dashboard truly useful.
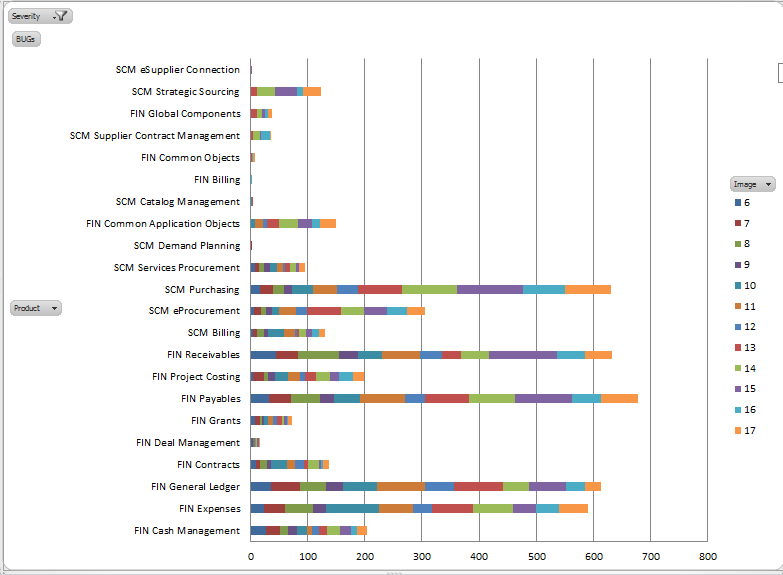
Even before this dashboard, one thing I have been doing for our organization is providing a spreadsheet report that lists all the BUGs we have not yet applied. In theory, this can now be replaced by the dashboard. However, our group is pretty used to this spreadsheet and it gives them a little more personalized control of this data. As the dashboard improves, I’m hoping this report can go away and everyone can just be directed to the dashboard.
Queries
In the past, to generate this report I had to create a “Get Current” change package in PUM. This would of course list all the unapplied BUGs in a grid online. I would export the grid to excel, then copy and paste into the report template. This worked fine, but now there is a better way – leveraging the PUM Dashboard queries.
The PUM Dashboard drives off of a set of queries. These queries all have a prefix of PTIA and can be found under the normal Query Viewer or Manager component in your PI. Here is a list of a few of them:
PTIA_BUG_TARGET_DETAILPTIA_BUG_IMAGE_DETAILPTIA_BUG_PRODUCT_DETAILPTIA_STATUS_BY_IMAGEPTIA_STATUS_BY_PROD
I found the PTIA_BUG_TARGET_DETAIL to be the most useful. This query was basically the same output I used to get with my change package grid export. One thing I did add to this detail was a link directly to the BUG Matrix in My Oracle Support(https://support.oracle.com/epmos/faces/BugMatrix?id=YOUR_BUG_ID_HERE). Our group has found this very useful when researching a BUG and wanting a little more detail than what is listed in PUM.
PUM Backlog Report
I have packaged up my spreadsheet report and posted it to GitHub, in case anyone else is interested. Since this report shows all unapplied BUGs from PUM, I have titled it the PUM Backlog Report. The instructions on how to import your PUM data is included in the readme file on GitHub, as well as in the spreadsheet itself. If you have questions or ideas for improvement, feel free to open an issue on GitHub or post in the comments below.
You can find the report on the psadmin.io GitHub site HERE.

Pingback: #20 – PUM Dashboard – psadmin.io
Pingback: #59 – Security Deployment